Data Collection Charts for Kids Experiments

 Discover a Free Education Video App for Kids
Pastory uses AI to personalize educational video content based on your child’s interests and personality. Safe, engaging, and built for curious young minds. Sign up now to stay updated and enjoy early access with a free trial

In the world of early childhood development, a science experiment is more than just a messy kitchen counter or a vinegar volcano; it is a fundamental building block for logical reasoning. When children engage in hands-on activities, they aren’t just playing—they are acting as mini-scientists. Using a data collection chart or graph allows them to move beyond “that was cool!” to “I wonder why that happened?” By providing a structured way to collect data, this approach helps children visualize their thinking and turn abstract observations into concrete evidence.
This guide explores how parents and educators can use a data collection chart, science experiment recording worksheet, and template to foster a love for inquiry. Whether you are following the KS2 science curriculum or just exploring at home, these learning resources for KS2 science help students aged 7-11 (and younger!) develop critical thinking skills through the power of data analysis. This guide shows how working scientifically with these interactive tools can become a seamless part of a child’s learning journey.
Introduction
A data collection chart is a simple visual tool used during children’s experiments at home or in classrooms to track what happens over time. At its core, it is a science skills notebook page that organizes thoughts. Instead of just watching a plant grow, a child uses a recording sheet to note its height daily. This turns passive observation into an active scientific investigation.
By using a printable science template, parents can provide a “road map” for discovery. These tools aren’t just for labs; they are for the backyard, the bathtub, and the breakfast table. They serve as the bridge between a child’s natural curiosity and the structured world of the scientific method.
Purpose of data collection in kids experiments
Experiments need recorded results because human memory is notoriously fickle—especially for a seven-year-old excited by a chemical reaction! Data collection brings structure to an activity. It teaches children that science is a process of gathering evidence to answer questions. When they collect data, they learn to value accuracy and detail, which are essential thinking skills and support understanding of the world around them.
Role of charts in hands-on science activities
Charts keep children engaged by giving them a “job” to do. Instead of waiting for a parent to finish the experiment, the child is the lead investigator. They must stay focused to catch the moment a color changes or a bubble pops so they can record data on their worksheet. This active participation transforms a demonstration into a more structured experiment where the child feels ownership over the real data they have gathered.
Suitable age ranges for chart-based experiments
The complexity of a chart should grow with the child.
- Preschool (Ages 3-5): Use simple charts with stickers or pictures. The goal is “more vs. less.”
- Kindergarten/Early Elementary (Ages 5-7): Introduce tally charts and numerical counting.
- KS2 Science Students Aged 7-11: At this stage, students use bar charts, line graphs, and simple pie charts. They can begin to analyze data to find patterns, aligning with learning resources for KS2 benchmarks.
Quick Recap: Data Science for Kids
Data science sounds intimidating, but for a child, it’s just the “story of what happened.” In the KS2 science curriculum, KS2 science focuses on how students develop the ability to see patterns in numbers.
Data examples children observe daily
Children are surrounded by real data. You can encourage them to collect data on:
- The color of cars driving past the house.
- The daily temperature (checking a thermometer).
- How many segments are in their lunchtime orange.
- The height of their LEGO towers.
Difference between data collection and data display
It is important to distinguish between the two steps. Data collection is the act of gathering info (the “doing” phase). Data display is when we present data using a bar chart, line graph, or bar charts or line graphs (the “showing” phase). A recording sheet is usually for the collection, while printable graph paper is for the display.
Basic data concepts used in experiments
| Concept | Definition for Kids |
| Counting | How many things are there? |
| Sorting | Putting things into groups by color, size, or shape. |
| Comparing | Which group is bigger or taller? |
| Pattern Spotting | Does this happen the same way every time? |
Science Experiment Recording Sheets
A science experiment recording sheet is a structured guide that helps students aged 7-11 stay on track.
Purpose of experiment recording sheets
These sheets act as scaffolding. They prompt the child to make predictions before they start and force them to analyze data once they finish. Without a template, an experiment can easily devolve into unstructured play.
Common recording sheet formats
- Tables: Great for comparing two different things (e.g., “Which ball bounces higher?”).
- Tick Charts: Simple “Yes/No” observations.
- Picture Charts: For younger kids to draw what they see at Step 1, Step 2, and Step 3.
Printable versus reusable recording sheets
Free science printable sheets are wonderful for one-off lessons. However, laminating a recording sheet and using a dry-erase marker allows for interactive learning resources that can be used repeatedly. Digital templates are also becoming popular for students aged 7–11 using BBC Bitesize resources or other educational platforms, where kids can input data directly into a tablet.
Benefits of Data Collection Charts for Kids
Using charts isn’t just about science; it’s about holistic brain development.
Skill development through chart usage
When students use charts, they are practicing:
- Mathematics: Counting, measuring, and understanding scale.
- Logic: Understanding cause and effect (e.g., “When I added more sugar, the crystal grew larger”).
- Organization: Keeping a neat science notebook.
Increased focus during experiments
A data collection task gives a child a specific goal. This “mission” reduces distractions. If they know they have to mark the bar chart every five minutes, they are much more likely to stay observant.
Confidence from visible experiment results
There is a massive sense of achievement when a child completes a line graph. It is a physical trophy of their hard work. Seeing the “line go up” provides a visual confirmation of their prediction, boosting their self-esteem as a learner.
Scientific Method for Kids Experiments
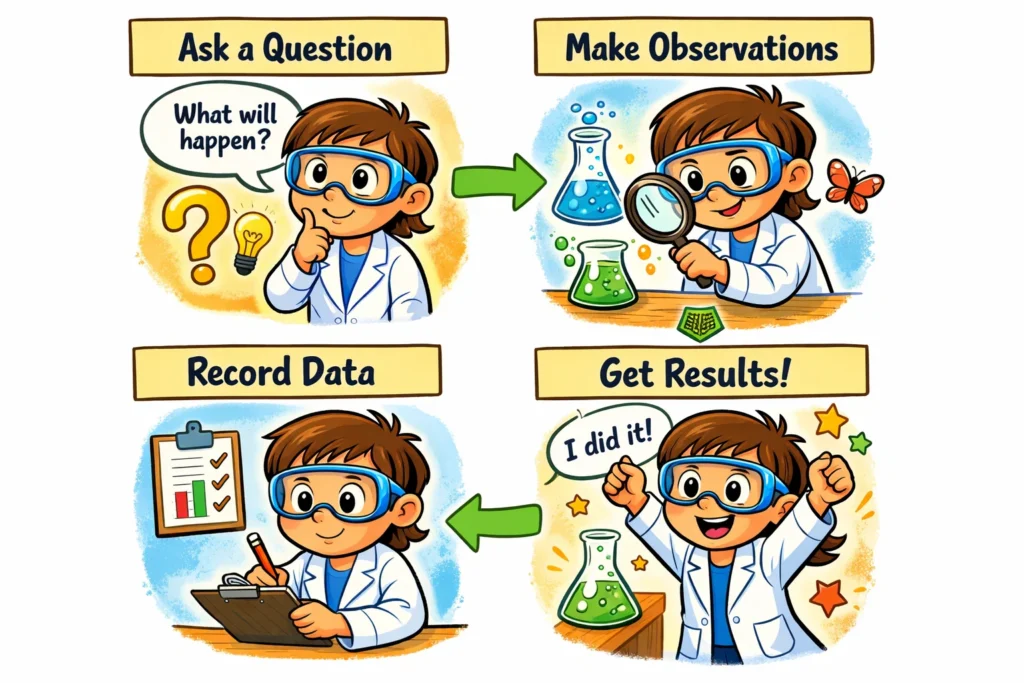
To work scientifically, children can follow a simplified scientific method using these tools.
- Question and prediction stage: “What will happen if…?” This is where they make predictions.
- Observation and data collection stage: The “active” phase where the recording sheet is filled.
- Result review and discussion stage: Looking at the chart and asking, “Was my prediction right?”
“Science is not just a body of knowledge; it is a way of thinking.” — Carl Sagan
STEM Activity: Making Charts with Kids
Creating the chart is just as educational as the experiment itself!
Choosing experiment topic
Select themes that offer clear numerical results.
- Biological: How many birds visit the feeder?
- Physical: How far does a toy car roll on different surfaces?
- Chemical: How long does it take for an ice cube to melt in different rooms?
Creating charts together with children
Don’t just hand them a finished worksheet. Use a ruler and markers to draw the axes together. Let them choose the colors. This collaborative approach to planning a science project makes the data feel “theirs.”
Interactive data collection process
For younger children, use stickers or physical objects (like beans) to collect data. As they grow into KS2 science students, they can move to drawing graphs with pencil and paper.
Planning Data Collection Process
Before the first bubble blows, you need a plan.
- Selecting data points: Focus on one clear variable. If plant growth is being tested, track height only, not height, color, and leaf count all at once.
- Choosing appropriate chart format: Use a tally chart for counting and a line graph for changes over time.
- Setting observation time: Is this a 10-minute experiment or a 10-day observation? Mark the times on the template beforehand.
Drawing Graphs from Experiment Data
Turning a table of numbers into a graph is where the magic happens.
Difference between charts and graphs
A chart (like a table) stores the data. A graph (like a bar chart) visualizes the data. Students aged 7-11 should learn to move from one to the other.
Using x-axis and y-axis for kids
Think of the axes like a ladder and a sidewalk.
- The X-axis (Horizontal): This is the “sidewalk.” It usually shows what we are changing (e.g., the type of liquid).
- The Y-axis (Vertical): This is the “ladder.” It shows how much (e.g., how many centimetres).
Setting scale for kids graphs
Use simple numbers. If the highest measurement is 10, the graph should go to 10. Avoid complex scales like “increments of 2.5” until they are much older.
Types of Data Collection Charts for Kids
| Chart Type | Best Used For… | Age Group |
| Tally Chart | Counting items quickly (e.g., bird sightings). | 5-8 |
| Picture Chart | Using icons or drawings to show quantity. | 3-6 |
| Bar Chart | Comparing different categories (e.g., favorite fruit). | 7-11 |
| Line Graph | Showing change over time (e.g., plant growth). | 9-11 |
Experiment Ideas Using Data Collection Charts
Weather tracking experiments
Students aged 7-11 using weather data resources (such as BBC Weather) often track rainfall. Use a clear jar to measure rain and record it on a line graph over a week.
Dice and probability experiments
Roll a die 50 times. Collect data on how often each number appears. Does a pie chart show they are all roughly equal? This is a great intro to data analysis.
Plant growth experiments
This is the classic KS2 science activity. Use a science experiment recording sheet to track a bean plant’s growth in the sun vs. in the dark.
Final Thoughts on Collecting Data with Kids
The goal of working scientifically is not to get the “right” answer, but to understand the process. By using a data collection chart, these charts give children the tools to explore the world with precision and curiosity.
Making experiments enjoyable and stress-free
Keep it light! If the bar chart gets a smudge or the numerical data is a bit messy, it’s okay. The focus is on the observation and the thinking skills being built.
Adapting charts for different age levels
As children grow, transition from free science printable sheets to having them design their own notebook layouts. This encourages independence and deeper critical thinking skills.
Reusing charts for repeated experiments
Encourage your child to repeat an experiment to see if the data collected is the same. This introduces the concept of reliability in science experiments, a key part of the KS2 science curriculum.
FAQ: Data Collection Charts for Kids Experiments
For very young children, picture charts are best. They can draw a picture of a sun or a cloud for the weather, or use stickers to represent how many apples they ate.
Ask open-ended questions like, “What do you think we should write down?” Let them lead the data collection while you assist with the tricky parts, like using a ruler.
Most children can begin understanding simple bar charts around age 6 or 7. By age 9 (KS2 science level), they can start drawing graphs with axes and labels.