6 Graphic Organizer Types Every Teacher & Student Should Know

 Discover a Free Education Video App for Kids
Pastory uses AI to personalize educational video content based on your child’s interests and personality. Safe, engaging, and built for curious young minds. Sign up now to stay updated and enjoy early access with a free trial

Graphic organizers are among the most versatile tools available to educators today. Whether you’re helping students brainstorm ideas, compare two characters, or map out the steps of a science experiment, the right tool can turn confusion into clarity.
This guide covers 6 graphic organizer types every teacher should know, along with practical classroom examples, subject-specific applications, and printable template options.
Graphic Organizer Definition & Purpose
A graphic organizer is a visual tool that helps students structure information spatially rather than in simple linear notes. Unlike a bulleted list, it uses shapes, arrows, and hierarchy to show how ideas connect, compare, or follow a sequence.
Visual Representation of Ideas
Graphic organizers turn abstract concepts into concrete visual maps by using shapes, lines, and spatial arrangement to show relationships between ideas. A circle map, for example, places a central concept in the middle and surrounds it with related ideas, making it immediately clear how information clusters together. This visual format allows students to see patterns and connections that might be invisible in traditional written notes.
Knowledge Structuring Before Writing
Teachers commonly use organizers as a pre-writing brainstorm tool, helping students group related facts and build logical flow before drafting essays or reports. A hamburger paragraph organizer, for instance, separates the topic sentence, supporting details, and closing sentence into distinct visual layers. This step-by-step structure reduces the cognitive overload that often comes with blank-page paralysis.
Classroom Tools for All Subjects
Graphic organizers are not limited to any single subject area. In math, Venn diagrams help students visually compare and contrast number sets or geometric shapes. In ELA, plot maps guide students through story structure, while science classes use fishbone diagrams to explore cause-and-effect relationships, and social studies lessons benefit from timelines that sequence historical events in order.
Why Use Graphic Organizers in Class
Research consistently supports the use of visual tools in education. Graphic organizers help students retain information more effectively, support diverse learning needs, and increase overall classroom participation.
Boosts Knowledge Retention
The visual-spatial arrangement of a graphic organizer supports stronger memory encoding than linear note-taking alone. According to research published in Educational Psychology Review, students who used graphic tools during learning showed significantly improved recall compared to those using traditional notes. When information is organized visually, students can more easily retrieve it during assessments and apply it in new contexts.
Supports Diverse Learners
Graphic organizers reduce cognitive load by breaking complex information into manageable, clearly labeled sections. They are particularly beneficial for students with learning disabilities, ADHD, and English Language Learners (ELLs), as the structured format provides scaffolding without oversimplifying content. Rather than processing a wall of text, these students can focus on one box or column at a time, making participation more accessible.
Increases Student Engagement
Interactive formats like KWL charts, exit ticket organizers, and comic strips raise participation because students prefer visual and hands-on tasks over passive reading. When students physically fill them in — whether on paper or a digital template in Google Classroom — they take a more active role in their own learning. This sense of ownership tends to increase motivation and classroom energy.
6 Essential Graphic Organizers for Any Lesson
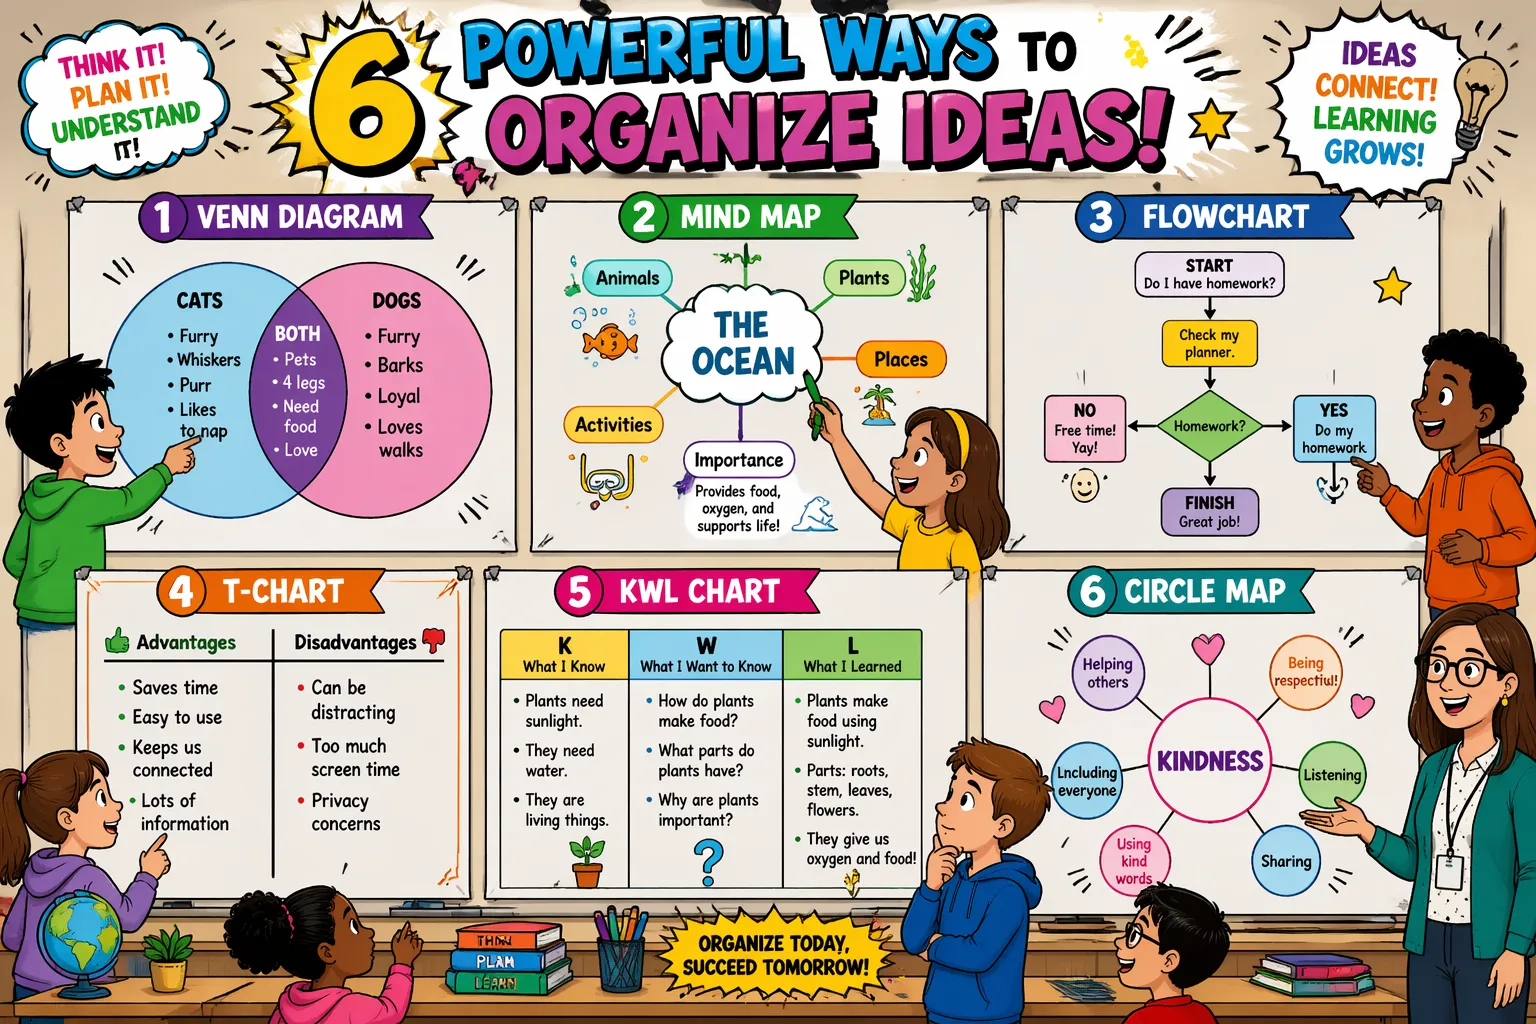
These are the six core graphic organizer types that work across grade levels, subjects, and learning goals. Each one targets a different cognitive task, from brainstorming to sequencing to comparison. You can make them yourself or download free printables from teacherspayteachers.com/browse/free, template.net/printable, canva.com/graphs, and other resources.
1. Circle Map for Brainstorming
The circle map places a key term or concept in a small inner circle, with a larger surrounding circles for related ideas, examples, or associations. Teachers use it to activate prior knowledge at the start of a lesson or to explore vocabulary in depth. It’s one of the most accessible tools for younger students because the open format invites free thinking without rigid structure.
2. Spider Map for Main Ideas & Details
A spider map features a central topic connected to multiple “legs,” each representing a subtopic or supporting detail. It works well for note-taking during read-alouds, planning essays with several supporting points, or organizing science classification tasks. The visual branching helps students see at a glance how details connect back to the main idea.
3. Venn Diagram for Comparison Tasks
The Venn diagram uses two or three overlapping circles to organize a compare and contrast activity. Similarities go in the overlapping section, while differences stay in the outer portions of each circle. Teachers use Venn diagrams to compare characters in a novel, contrast historical events, or highlight differences between animal groups in science.
4. T-Chart for Pros & Cons or Facts vs. Opinions
The T-chart divides information into two clearly labeled columns, making it ideal for weighing advantages and disadvantages, separating facts from opinions, or organizing a before-and-after comparison. It’s one of the most flexible organizers available — simple enough for early elementary students, but equally useful for middle school persuasive writing and argumentative writing tasks.
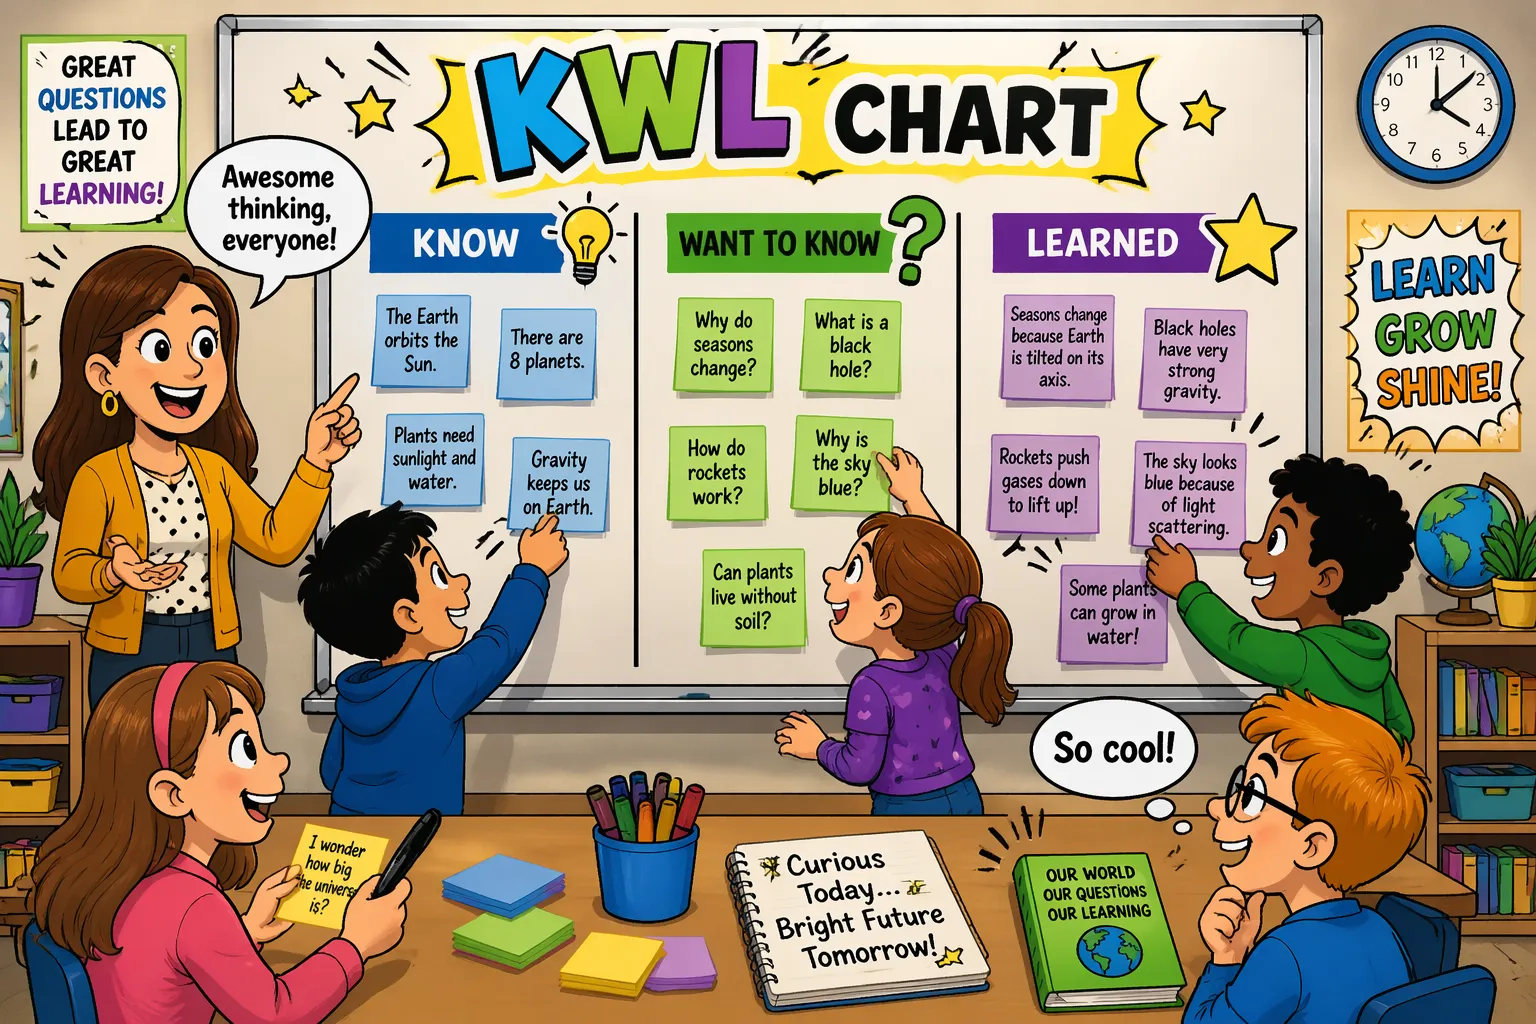
5. KWL Chart for Lesson Launch
The KWL chart organizes learning into three columns: Know, Want to know, and Learned. At the start of a unit, students fill in what they already know and what they’re curious about, then return to the “Learned” column at the end as a form of formative assessment. A variation — the K-W-H-L chart — adds a fourth column asking how students will find out, encouraging research skills and metacognitive thinking.
6. Sequence of Events Chain for Timelines & Processes
A sequence chain uses ordered boxes connected by arrows to map out steps, stages, or events in chronological order. It’s well-suited for tracking a story’s plot, mapping out a scientific process like the water cycle, or organizing a historical timeline. Students who struggle with sequencing in writing often find this organizer especially helpful for planning their narrative structure before drafting.
Additional Graphic Organizers by Learning Task
Beyond the core six, teachers can draw on a wider toolkit matched to specific cognitive goals. Here are four additional categories organized by learning task:
- Categorizing tools: Column organizers and Carroll diagrams (yes/no grids) help students sort animals, shapes, or historical figures into clearly defined groups.
- Problem-solving tools: Fishbone diagrams visualize cause-and-effect relationships, while pro-con organizers support debates and ethical reasoning.
- Vocabulary builders: The Frayer Model breaks a word into its definition, facts, examples, and non-examples — a powerful strategy for academic vocabulary development. Word wheels work similarly for exploring synonyms and related terms.
- Writing planners: The hamburger paragraph organizer visually separates a topic sentence, supporting details, and closing sentence. Five-paragraph essay maps extend this structure for longer argumentative writing or biography assignments.
Subject-Specific Graphic Organizer Examples
Different subjects call for different formats. Here’s how to match the right visual tool to each core content area.
Literature — Plot Maps & Character Analysis
In ELA, the plot diagram guides students through the five stages of narrative structure: exposition, rising action, climax, falling action, and resolution. Character analysis charts pair a character trait with textual evidence, helping students move from surface-level observations to deeper literary analysis. Both organizers support figurative language study and response writing tasks.
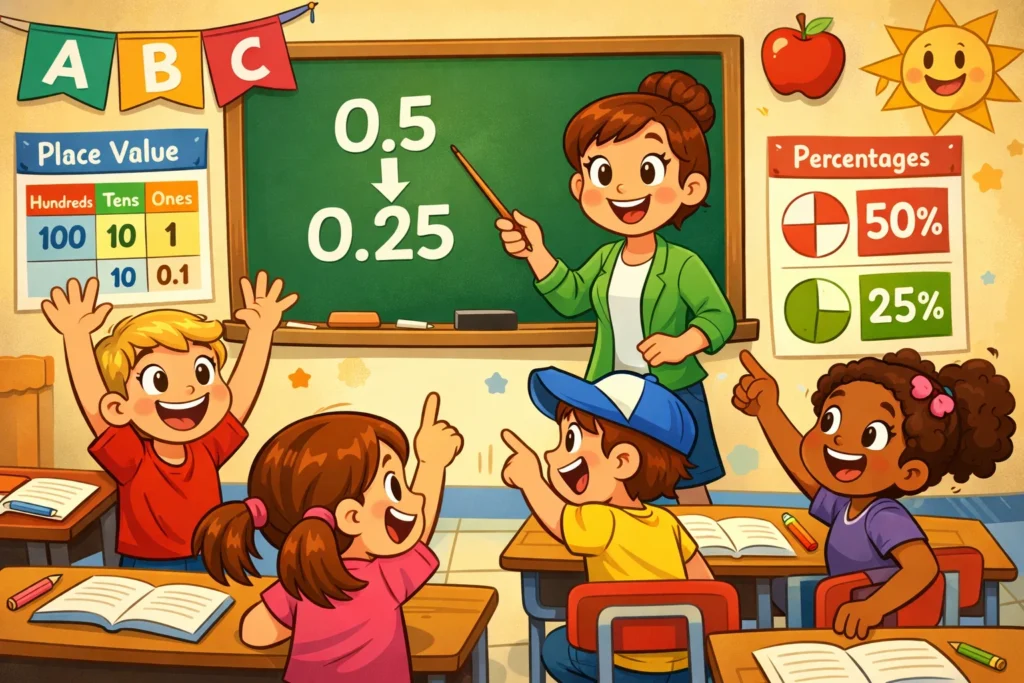
Math — Venn Diagrams & Place Value Charts
In math, Venn diagrams help students visually compare number properties, sets, or geometric shapes. Base-10 block organizers support place value work, helping students decompose numbers into hundreds, tens, and ones for addition and subtraction. These visual formats make abstract numerical relationships concrete and easier to manipulate.
Science — Cause & Effect Chains & Spider Grams
Science lessons benefit from cause-and-effect chains that show how one event or condition leads to another — for example, mapping the stages of photosynthesis or tracing the effects of pollution on an ecosystem. Spider grams work well for classification tasks, such as organizing animal kingdoms or mapping the components of a food web around a central concept.
Social Studies — Timelines & Relationship Trees
Timeline frames with five to eight labeled boxes help students sequence historical events while connecting dates to context. Relationship trees visualize hierarchical structures like government branches, family trees, or networks of historical influence, giving students a clear spatial map of how figures or institutions connect to one another.
How to Select the Right Graphic Organizer for a Task
Choosing the right organizer comes down to matching the format to the cognitive goal. Use this quick reference guide:
| Learning Goal | Best Organizer |
| Compare two or more things | Venn Diagram or T-Chart |
| Sequence events or steps | Chain of Events or Timeline |
| Categorize information | Column or Carroll Diagram |
| Describe a main idea with details | Spider Map or Idea Wheel |
| Activate and track new knowledge | KWL or K-W-H-L Chart |
| Plan a paragraph or essay | Hamburger Paragraph or Essay Map |
When selecting an organizer, consider three questions: What is the primary cognitive task? What is the student’s grade level? And will this organizer be used for brainstorming, note-taking, or assessment? Matching format to function is what makes graphic organizers genuinely effective rather than just visually appealing.
Start Using Graphic Organizers Today
Graphic organizers are one of the most practical, research-supported tools a teacher can add to their classroom toolkit. They work across every subject, adapt to every grade level, and support students with a wide range of learning needs.
To get started quickly, try these three steps:
- Pick one lesson this week and identify the primary cognitive task — comparing, sequencing, categorizing, or describing.
- Choose the matching organizer from the six core types covered in this guide.
- Introduce it to students with a brief modeling session before asking them to complete it independently.
With consistent use, graphic organizers help students build stronger thinking habits, improve writing quality, and approach complex tasks with more confidence. The best organizer isn’t necessarily the most elaborate one — it’s the one that fits the task and helps students think more clearly.
Frequently Asked Questions
What Does a Graphic Organizer Do?
A graphic organizer transforms abstract ideas into a structured visual format that shows relationships, sequence, hierarchy, or comparison at a glance. Rather than asking students to hold multiple ideas in working memory, the organizer externalizes that structure on the page, making thinking visible and easier to refine.
Is a Table a Graphic Organizer?
Yes. Tables — including two-column and three-column formats — qualify as graphic organizers because they organize data spatially using rows and columns. T-charts and column organizers are among the most widely used table-based organizers in classroom settings.
Are Graphic Organizers Only for Younger Students?
No. Graphic organizers are used effectively in middle school, high school, and even college settings for essay planning, debate preparation, research note-taking, and reflection logs. The format scales with complexity — a high school student mapping an argumentative essay uses the same underlying structure as a second grader planning a paragraph.
Can Graphic Organizers Be Used for Assessment?
Yes. Exit ticket organizers — such as a Stoplight chart (what I understand/what I’m unsure about) or a Glow and Grow reflection — serve as quick formative assessment tools. The “Learned” column of a KWL chart also functions as a meaningful end-of-lesson assessment, showing what students retained and where gaps remain.